4/15-5/3: Central Library Lower Level/Children’s Library area will be closed due to construction work.
Recent Public Meetings About Rates
- 10/19/24 Water Commission: Report & Video
- 1/18/24 Water Commission: Report & Video
- 2/15/24 Water Commission: Report & Video
- 2/27/24 Finance Committee: Report & Video
- 2/27/24 City Council: Report & Video
- 3/21/24 Water Commission: Report & Video
- 4/9/24 Finance Committee: Report & Video
- 4/9/24 City Council: Report & Video
Contact Us
WaterResources@SantaBarbaraCA.gov
(805) 564-5387
How Rate Changes Are Ensuring Water and Wastewater Reliability
Attend our Water & Wastewater Rate Informational Webinar
Wednesday, May 22 at 6:00 p.m.
Ensuring Sufficient Rates to Fund Critical Infrastructure
Santa Barbara’s water and wastewater systems represent some of the largest public infrastructure investments in our City. In order to implement a long-term plan to replace aging infrastructure and to ensure reliable, 24/7 service, the City is proposing annual rate adjustments over the next four years. This recommendation is based on the cost to provide services to guarantee rates are sufficient to:
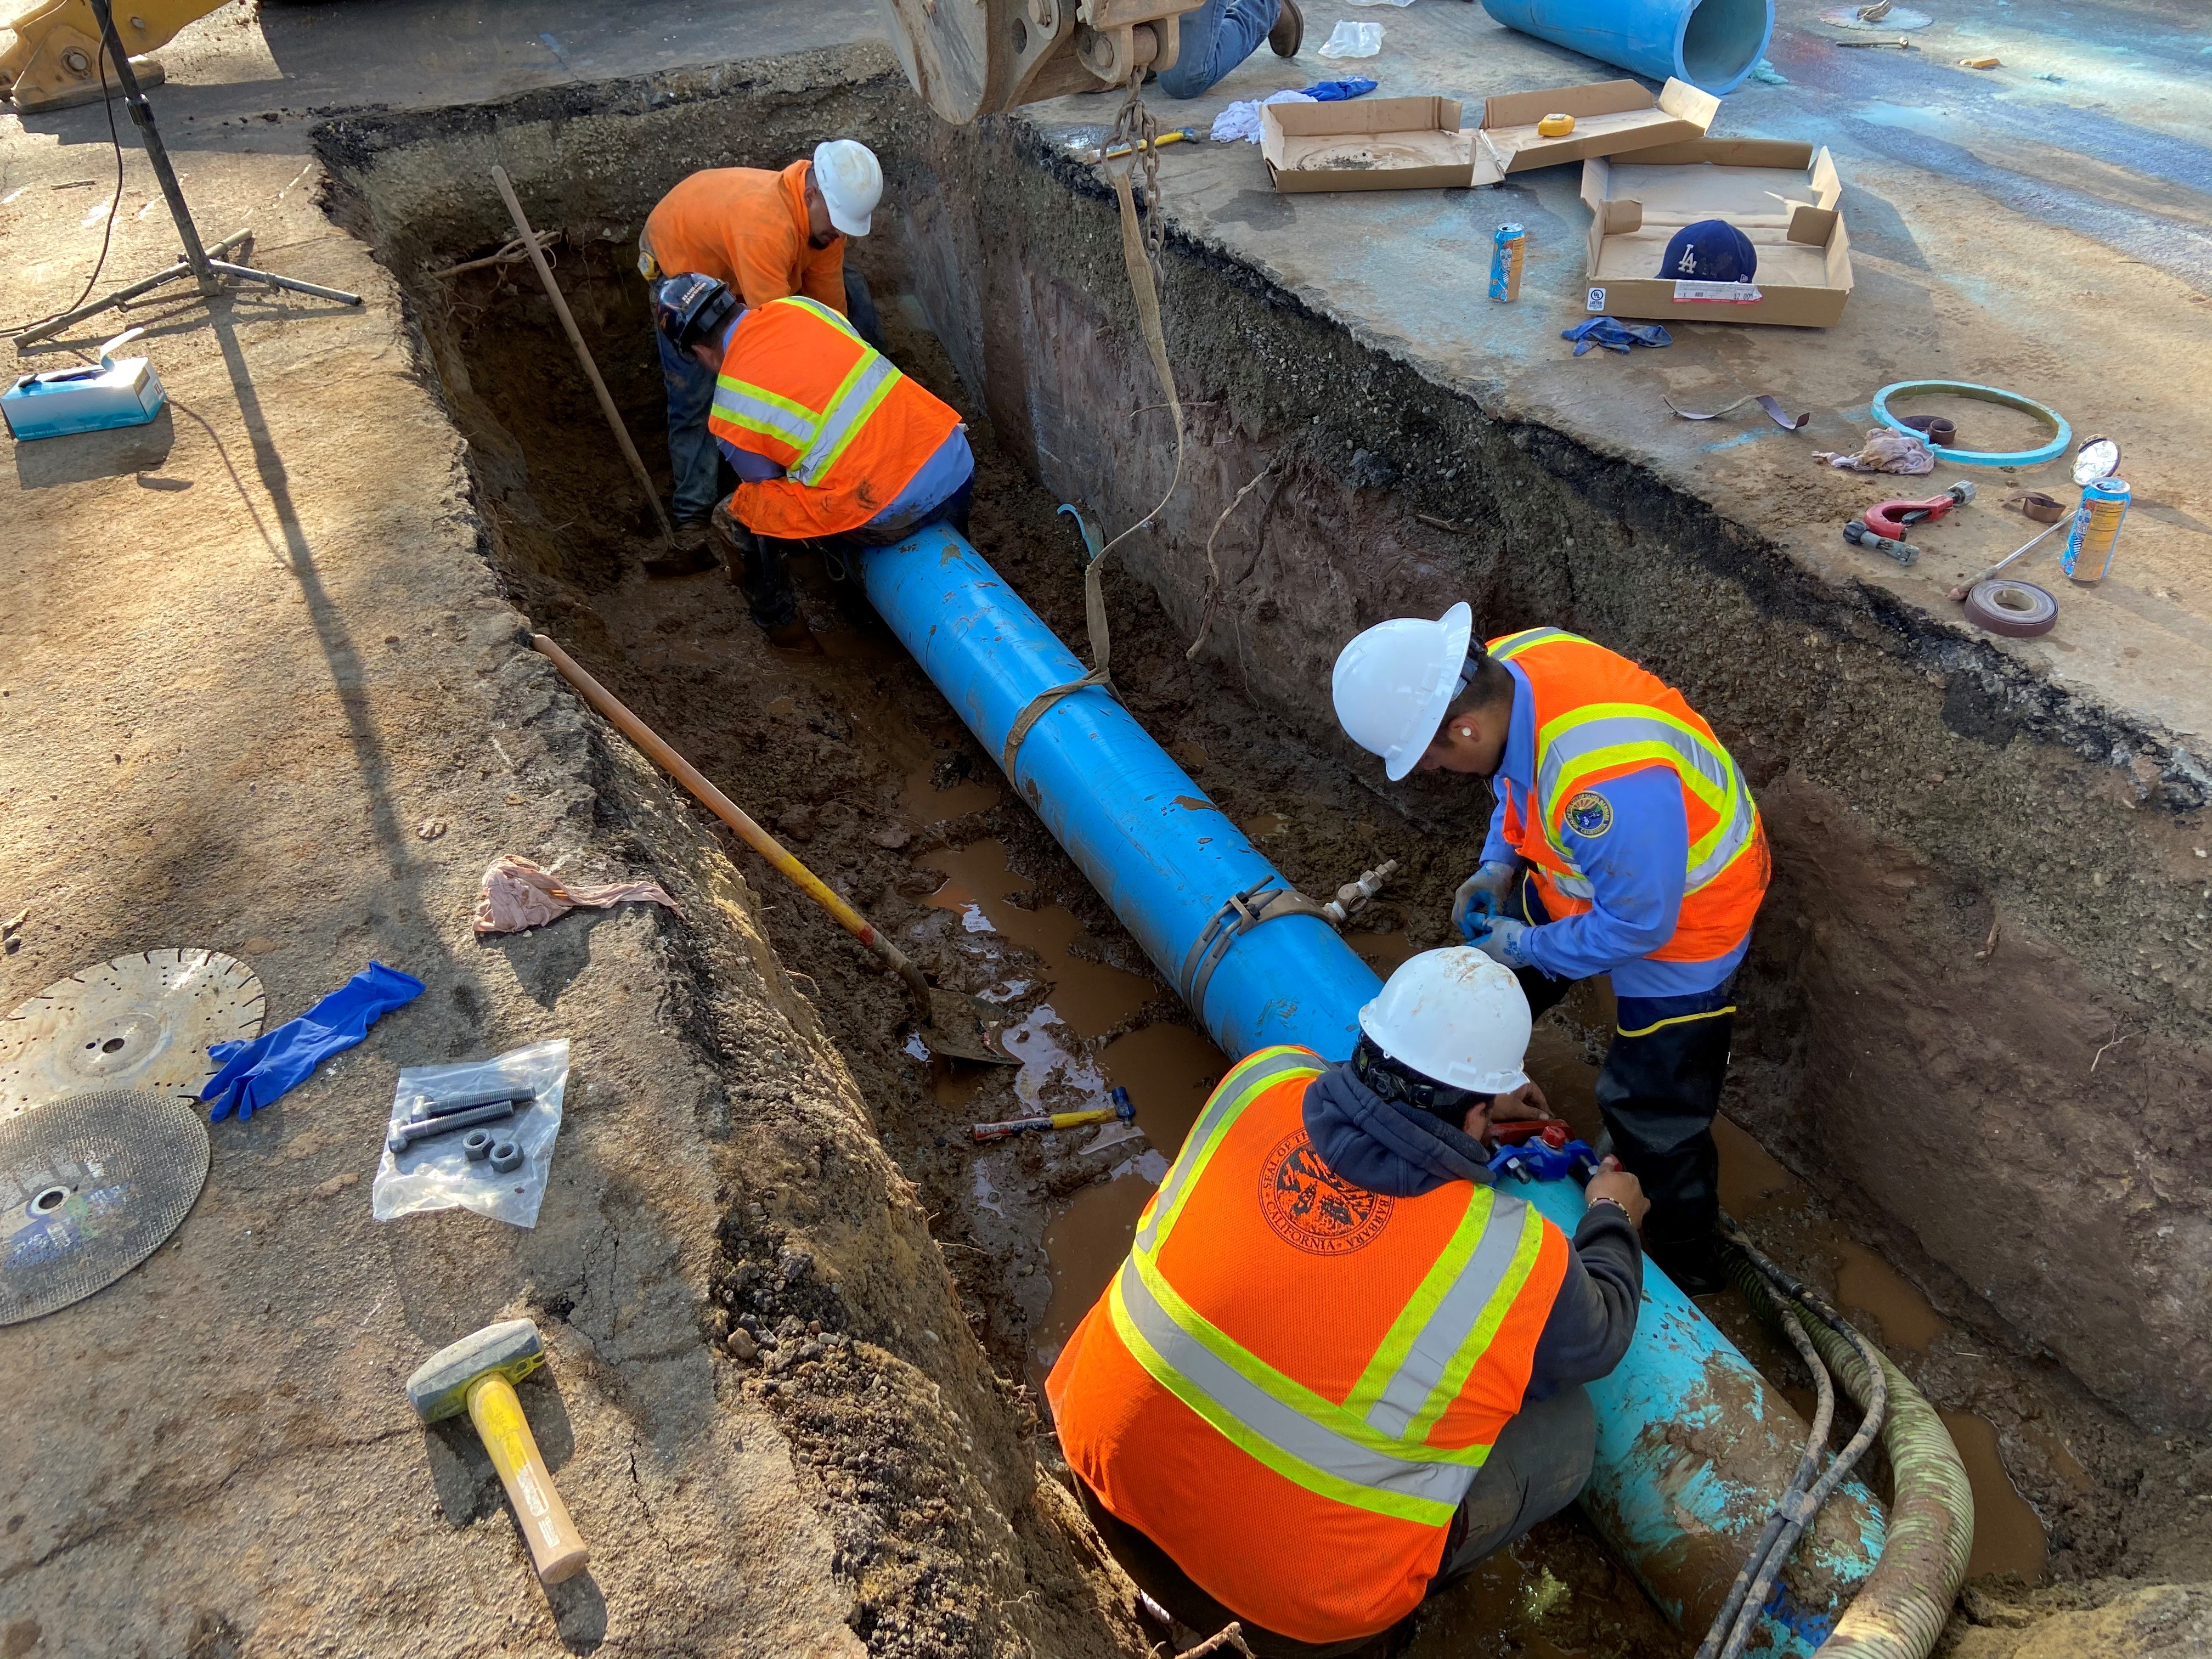
- Cover costs needed to operate and maintain over 600 miles of pipes, four treatment plants, and other essential facilities.
- Invest in critical improvement projects, including replacing old pipes and infrastructure that have reached the end of their useful lives.
- Recover from inflationary increases that have far outpaced the costs rates were initially set to recover.
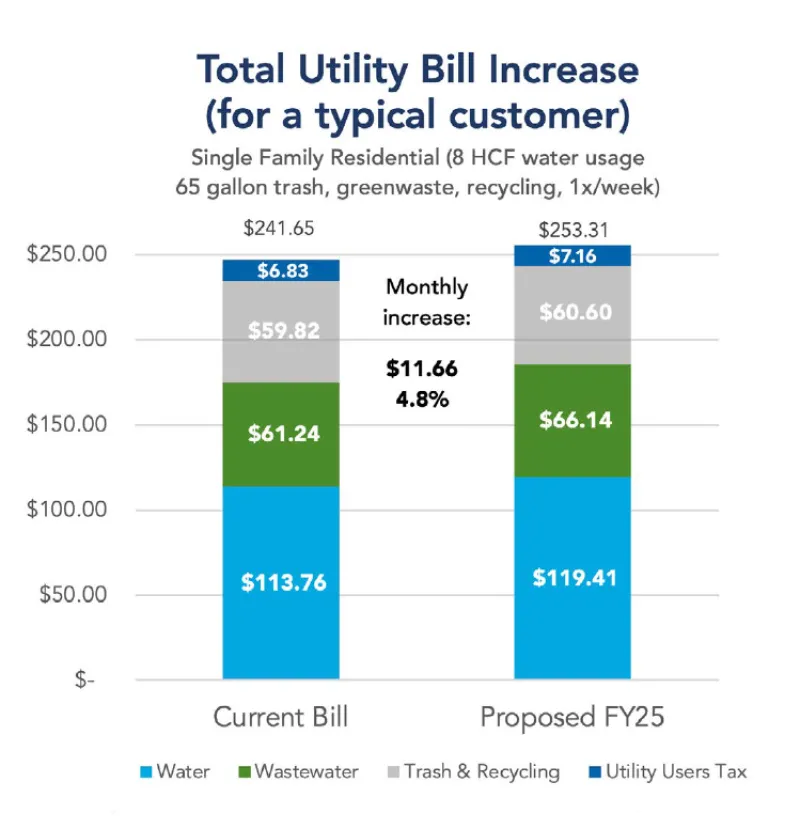
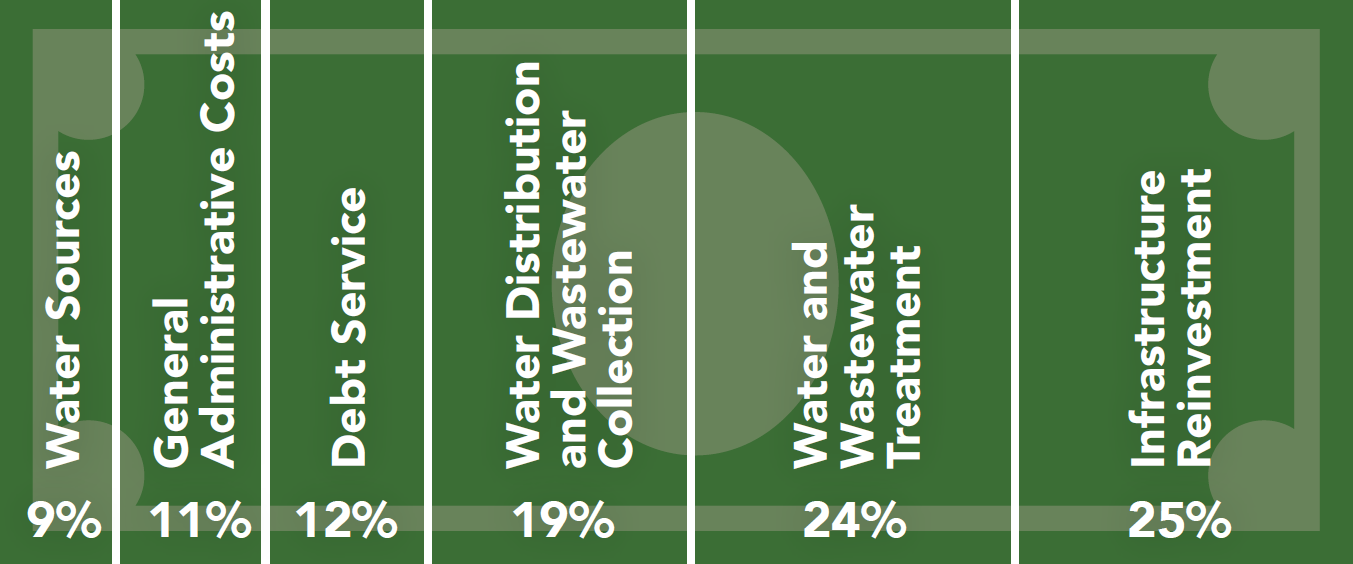
What Your Bill Pays For
Your monthly bill helps ensure we keep our water and wastewater systems maintained and operating around the clock, which is key to protecting public health and the environment.
Proposed Rate Increases
As a public utility, our rates can only include the costs of providing water and wastewater utility services. Revenues from rates are used to run the utilities and do not generate profit or go towards other City programs.
Unfortunately, “do nothing” is not an option for maintaining critical infrastructure. Delaying important investments will only make it more expensive in the future and could lead to emergencies that will be exponentially more expensive and disruptive than planned maintenance. To implement a vital, long-term plan to replace pipes and infrastructure, the City of Santa Barbara is proposing annual rate adjustments over the next four years for water and wastewater services.
Customer Assistance is Available
The City understands the difficulties we all face from rising costs and is working hard to minimize rate increases while ensuring safe and reliable services that we rely on 24/7. For water customers, we continue to offer customer assistance programs including payment arrangement plans, a waiver of the Utility Users Tax for qualifying low-income customers, water leak relief, and a mixture of residential and commercial rebates to encourage the efficient use of water. We’ve recently partnered with the Alliance for Water Efficiency on a Water Rate Affordability Study to evaluate utility rate affordability challenges and potential solutions.
Rate Comparisons with Neighboring Agencies
Frequently Asked Questions
The majority of costs to operate the City’s water system and deliver safe, reliable drinking water are fixed costs that do not change based on water supply availability. Regardless of how much it has rained, the City must operate and maintain over 320 miles of water mains, treat an average of 10 millions of gallons of water a day, conduct over 1,000 water quality tests a month, and invest in important capital projects to keep the water system running smoothly. Like other goods and services, the cost of the physical materials the City needs to operate the water system, such as water main pipe materials, has drastically increased over recent years.
For a typical single family customer with water, sewer, and trash service and average monthly water use, the total utility bill will increase by about $11.66, or 4.8% per month. See the below chart for a breakdown in the change in cost.
The City makes every effort to keep our rates as low as possible for our customers while still providing sufficient revenue to operate and maintain the water system.
The City has executed two long-term water supply agreements: (1) a Recycled Water Agreement with the La Cumbre Mutual Water Company, and (2) a Water Supply Agreement (WSA) with Montecito Water District for the sale of potable water secured by the Charles E. Meyer Desalination Plant. Without these agreements, particularly the WSA, the City would need to either significantly increase rates above what is being proposed, reduce planned capital investments in aging infrastructure, or execute a combination of these actions. The City has also implemented a grant strategy that involves identifying, tracking, pre-positioning and pursuing grants for which the water utility is eligible.
We continue to offer customer assistance programs including payment plans, utility tax waivers, low-income household water assistance, and leak relief. For more information on our customer assistance programs, please get in touch with Utility Billing staff. The City’s Water Conservation program also offers rebates to help you save water and money.
If adopted, you will see the FY25 rates on your first bill where the entire service period is July 1, 2024 or later. These bills will be sent to customers beginning September 2024.
Development projects are required to pay capacity charges for new or increased water connections. This is because existing customers have been funding the utility system assets such as pipes, pumping stations, treatment plants and reservoirs through their monthly water bill payments. Capacity charges make it equitable for new and existing customers to be billed at the same rates. Water and sewer capacity charges for a new 5/8” meter (the smallest meter the City offers) total about $14,400 for a home or small commercial development project, plus the cost to physically construct the new connections. Charges increase based on meter size.
The water use from development projects add, on average, 40 acre-feet per year which is 0.35% of our annual water demand. In the City, almost all development is redevelopment, as there are very few vacant parcels. Some projects result in a net water reduction in water use due to stringent plumbing codes and landscape requirements that promote more efficient water use.
The City is a leader in water conservation and has designed its rate structure to promote the efficient use of water. Water bills are made up of two key components: (1) a volumetric charge based on water use and (2) a fixed monthly service charge based on meter size. Even though most of the costs to maintain and operate the water system are fixed, the City’s water rate structure is designed to minimize increases to fixed charges and collect most of the revenue (~70%) through volumetric charges, which are dependent on water usage.
This gives customers more of an opportunity to reduce their water bill by decreasing water use. The City’s tiered rate structure is supported with a diverse water supply portfolio, with different supply costs for each of the City’s associated water sources. As shown in the comparison charts above, the City offers some of the lowest water and sewer charges in our local area for low water users.
Water affordability, conservation, and equitable access were identified as important community values in the Water Vision Santa Barbara effort conducted in 2020. Providing affordable and equitable access to clean water is a primary objective of the City’s Water Resources Division. To meet this objective, the City partnered with the Alliance for Water Efficiency (AWE) to conduct a Water Affordability and Conservation Study to better understand challenges and opportunities related to water affordability.
This study leveraged Census data along with household-level water consumption and billing data to reveal impacts to the lowest income households and variation in affordability issues across different areas of the City. The study included an assessment of water affordability, community outreach and engagement, example affordability and assistance programs across California, and strategies to mitigate water affordability challenges. The City is in the process of prioritizing the Study’s strategies for implementation.
Proposed Water Rates
Proposed Volumetric Water Rates
All rates are in $/HCF. 1 HCF (Hundred Cubic Feet) = 748 gallons.
|
|
| Proposed | |||
Customer Class | Tiers | Current | FY25 | FY26 | FY27 | FY28 |
Single Family Residential | First 4 HCF | $5.10 | $5.49 | $6.06 | $6.67 | $7.34 |
Next 12 HCF | $15.19 | $15.31 | $16.92 | $18.61 | $20.47 | |
All other HCF | $28.54 | $34.90 | $38.56 | $42.42 | $46.66 | |
Multi-Family Residential | First 4 HCF (per dwelling unit) | $5.10 | $5.49 | $6.06 | $6.67 | $7.34 |
Next 4 HCF (per dwelling unit) | $15.19 | $15.31 | $16.92 | $18.61 | $20.47 | |
All other HCF | $28.54 | $34.90 | $38.56 | $42.42 | $46.66 | |
Commercial/Industrial | 100% of base allotment | $7.77 | $8.19 | $9.05 | $9.96 | $10.96 |
All other HCF | $28.45 | $37.82 | $41.80 | $45.98 | $50.58 | |
Irrigation – Residential & Commercial | 100% of monthly water budget* | $15.19 | $15.31 | $16.92 | $18.61 | $20.47 |
All other HCF | $28.54 | $34.90 | $38.56 | $42.42 | $46.66 | |
Irrigation – Recreation/Parks/Schools | 100% of monthly water budget* | $5.98 | $7.26 | $8.02 | $8.82 | $9.70 |
All other HCF | $28.54 | $34.90 | $38.56 | $42.42 | $46.66 | |
Irrigation – Agriculture | 100% of monthly water budget* | $3.98 | $5.13 | $5.67 | $6.24 | $6.86 |
All other HCF | $28.54 | $34.90 | $38.56 | $42.42 | $46.66 | |
Recycled Water | All HCF | $4.99 | $6.10 | $6.74 | $7.41 | $8.15 |
*The Monthly Water Budget for irrigation accounts is a calculation of Tier 1 allotment based on the property’s irrigated landscape area and the monthly watering needs of plants.
Proposed Maximum Fixed Monthly Service Charges
Charges based on meter size.
| 5/8” | 3/4” | 1” | 1 ½” | 2” | 3” | 4” | 6” | 8” | 10” | |
Current | $32.60 | $47.73 | $77.97 | $153.59 | $244.33 | $531.67 | $955.12 | $1,968.37 | $3,631.93 | $5,749.18 | |
Proposed | FY25 | $36.21 | $52.50 | $85.09 | $166.55 | $264.30 | $573.86 | $1,030.06 | $2,121.66 | $3,913.84 | $6,194.80 |
FY26 | $40.01 | $58.01 | $94.02 | $184.04 | $292.05 | $634.12 | $1,138.22 | $2,344.43 | $4,324.79 | $6,845.25 | |
FY27 | $44.01 | $63.81 | $103.42 | $202.44 | $321.26 | $697.53 | $1,252.04 | $2,578.87 | $4,757.27 | $7,529.78 | |
FY28 | $48.41 | $70.19 | $113.76 | $222.68 | $353.39 | $767.28 | $1,377.24 | $2,836.76 | $5,233.00 | $8,282.76 |
Proposed Wastewater Rates
Proposed Residential Volumetric & Fixed Wastewater Rates (Table 1)
1 HCF (hundred cubic feet) = 748 gallons. FY = fiscal year July 1—June 30
|
|
| Proposed | |||
Customer Class | Charge Type | Current | FY25 | FY26 | FY27 | FY28 |
Single Family Residential | Monthly Base Charge ($/Dwelling Unit) | $27.00 | $29.90 | $32.74 | $35.85 | $39.26 |
Usage Charge up to 8 HCF ($/HCF) | $4.28 | $4.53 | $4.96 | $5.43 | $5.95 | |
Multi-Family Residential 4 or less Dwellings | Monthly Base Charge ($/Dwelling Unit on account) | $27.00 | $29.90 | $32.74 | $35.85 | $39.26 |
Usage Charge ($/HCF) | $4.28 | $4.53 | $4.96 | $5.43 | $5.95 | |
Multi-Family Residential 5+ Dwellings | Monthly Base Charge ($/Dwelling Unit on account) | $27.00 | $29.90 | $32.74 | $35.85 | $39.26 |
Usage Charge ($/HCF) | $4.28 | $4.53 | $4.96 | $5.43 | $5.95 |
Commercial and Commercial High Strength/Industrial customers are charged a fixed charge dependent on meter size (Tables 2-3), or a volumetric charge dependent on the quantity of water consumed (Table 4), whichever is greater.
Proposed Commercial Wastewater Fixed Charges (Table 2)
Charges based on water meter size.
| 5/8” | 3/4” | 1” | 1 ½” | 2” | 3” | 4” | 6” | 8” | 10” |
Current | $51.69 | $77.54 | $90.46 | $129.23 | $206.76 | $387.68 | $646.13 | $1,292.25 | $2,067.60 | $2,972.18 |
FY 2025 | $53.28 | $79.92 | $93.24 | $133.20 | $213.12 | $399.60 | $666.00 | $1,332.00 | $2,131.20 | $3,063.60 |
FY 2026 | $58.34 | $87.51 | $102.10 | $145.85 | $233.36 | $437.55 | $729.25 | $1,458.50 | $2,333.60 | $3,354.55 |
FY 2027 | $63.88 | $95.82 | $111.79 | $159.70 | $255.52 | $479.10 | $798.50 | $1,597.00 | $2,555.20 | $3,673.10 |
FY 2028 | $69.95 | $104.92 | $122.41 | $174.87 | $279.79 | $524.61 | $874.36 | $1,748.72 | $2,797.94 | $4,022.04 |
Proposed Commercial High Strength/Industrial Wastewater Fixed Charges (Table 3)
Charges based on water meter size.
| 5/8” | 3/4” | 1” | 1 ½” | 2” | 3” | 4” | 6” | 8” | 10” |
Current | $59.70 | $89.55 | $104.48 | $149.25 | $238.80 | $447.75 | $746.25 | $1,492.50 | $2,388.00 | $3,432.75 |
FY 2025 | $66.31 | $99.47 | $116.04 | $165.78 | $265.24 | $497.33 | $828.88 | $1,657.75 | $2,652.40 | $3,812.83 |
FY 2026 | $72.61 | $108.92 | $127.07 | $181.53 | $290.44 | $544.58 | $907.63 | $1,815.25 | $2,904.40 | $4,175.08 |
FY 2027 | $79.51 | $119.27 | $139.14 | $198.78 | $318.04 | $596.33 | $993.88 | $1,987.75 | $3,180.40 | $4,571.83 |
FY 2028 | $87.06 | $130.59 | $152.36 | $217.65 | $348.24 | $652.95 | $1,088.25 | $2,176.50 | $3,482.40 | $5,005.95 |
Proposed Volumetric Commercial Wastewater Rates in $/HCF (Table 4)
|
| Proposed | |||
Customer Class | Current | FY25 | FY26 | FY27 | FY28 |
Commercial | $5.27 | $6.56 | $7.18 | $7.86 | $8.61 |
Commercial High Strength/Industrial | $6.65 | $7.23 | $7.92 | $8.67 | $9.49 |
Proposed Wastewater Strength Surcharges in $/lb (Table 5)
If the City’s Water Resources Laboratory determines that a customer has exceeded the high strength discharge limit for Biochemical Oxygen (BOD), Total Suspended Solids (TSS), or Ammonia, a surcharge will be assessed for each constituent in excess of its relative limit.
| Current | FY25 | FY26 | FY27 | FY28 |
BOD (>750 mg/l) | $0.34 | $0.30 | $0.33 | $0.36 | $0.39 |
TSS (>850 mg/l) | $0.48 | $0.58 | $0.64 | $0.70 | $0.77 |
Ammonia (>90 mg/l) | $1.17 | $1.37 | $1.50 | $1.64 | $1.80 |