Cómo los cambios de tarifas garantizan la confiabilidad del agua y las agua residuales
Vea la grabación de nuestro seminario web informativo del 22 de mayo sobre las tarifas propuestas para el agua y las aguas residuales.
Garantizar tarifas suficientes para financiar infraestructuras críticas
Los sistemas de agua y aguas residuales de Santa Bárbara representan algunas de las mayores inversiones en infraestructuras públicas de nuestra ciudad. Con el fin de implementar un plan a largo plazo para reemplazar la infraestructura envejecida y para garantizar un servicio confiable, 24/7, la Ciudad propone ajustes anuales de tarifas durante los próximos cuatro años. Esta recomendación se basa en el coste de prestación de los servicios para garantizar que las tarifas sean suficientes para:
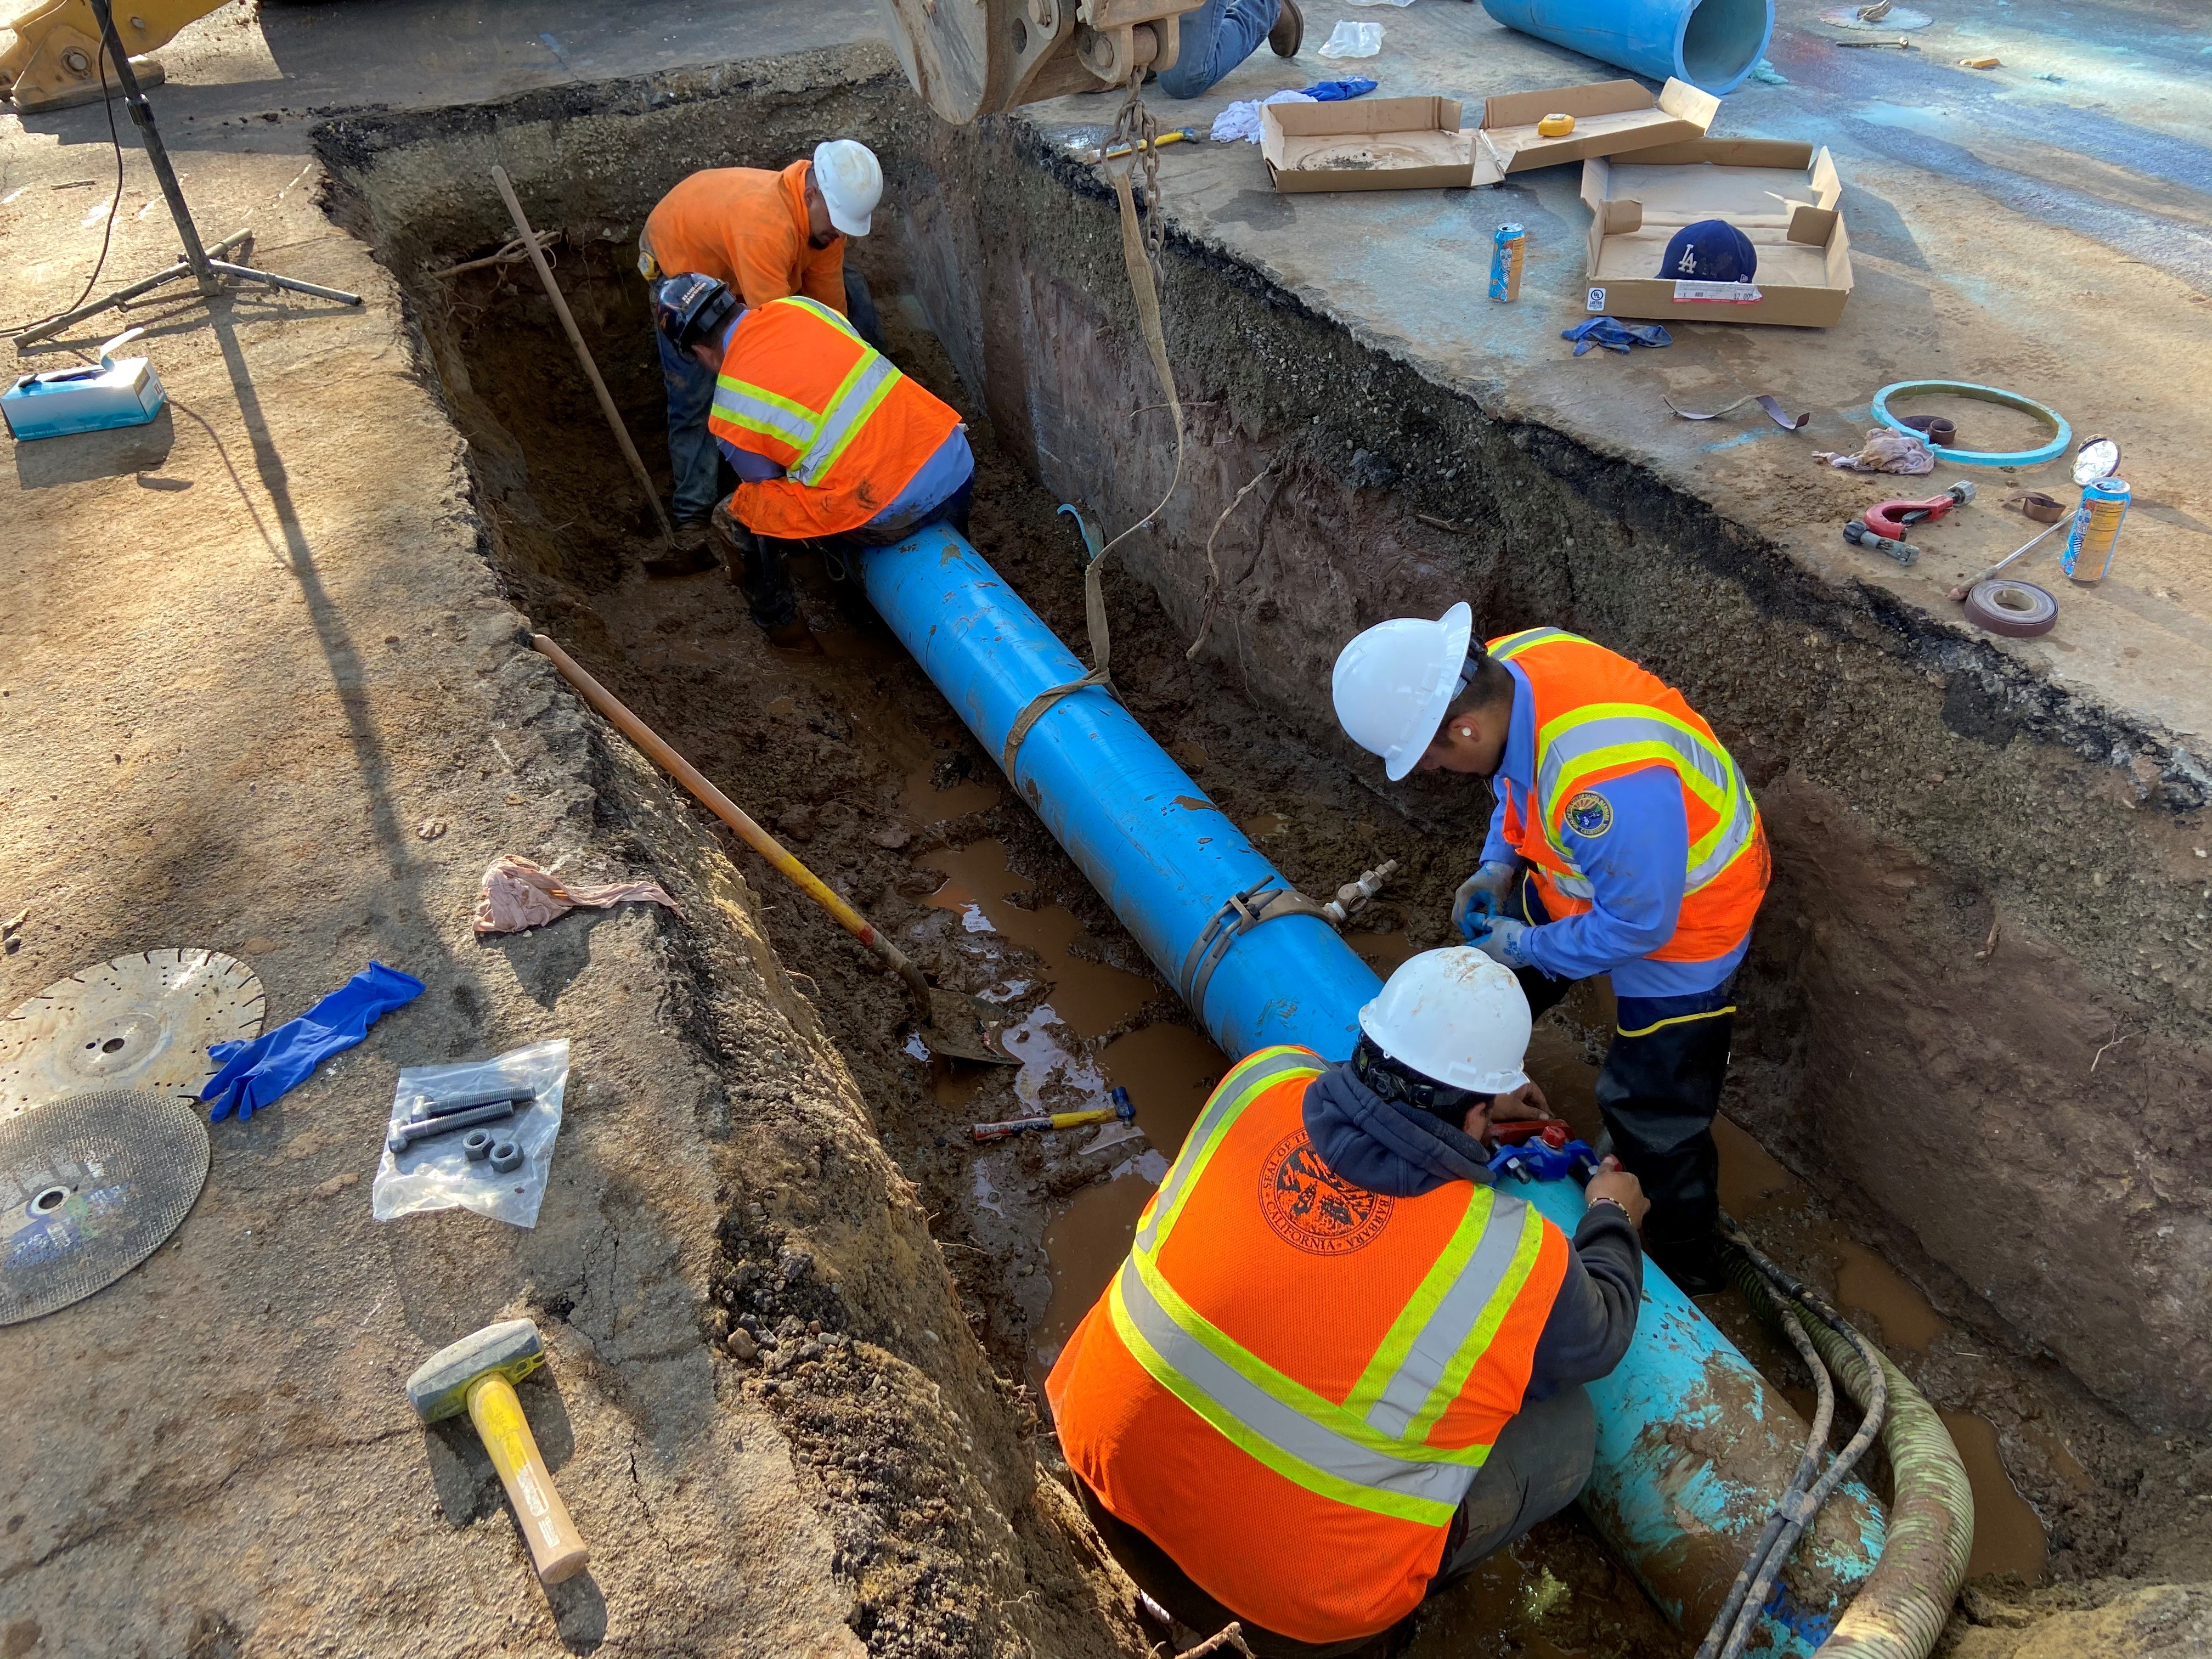
Cubrir los costos necesarios para operar y mantener más de 600 millas de tuberías, cuatro plantas de tratamiento y otras instalaciones esenciales.
Invertir en proyectos de mejora críticos, incluida la sustitución de tuberías e infraestructuras antiguas que han llegado al final de su vida útil.
- Recuperarse de los aumentos inflacionistas que han superado con creces los costos para cuya recuperación se fijaron inicialmente las tarifas.
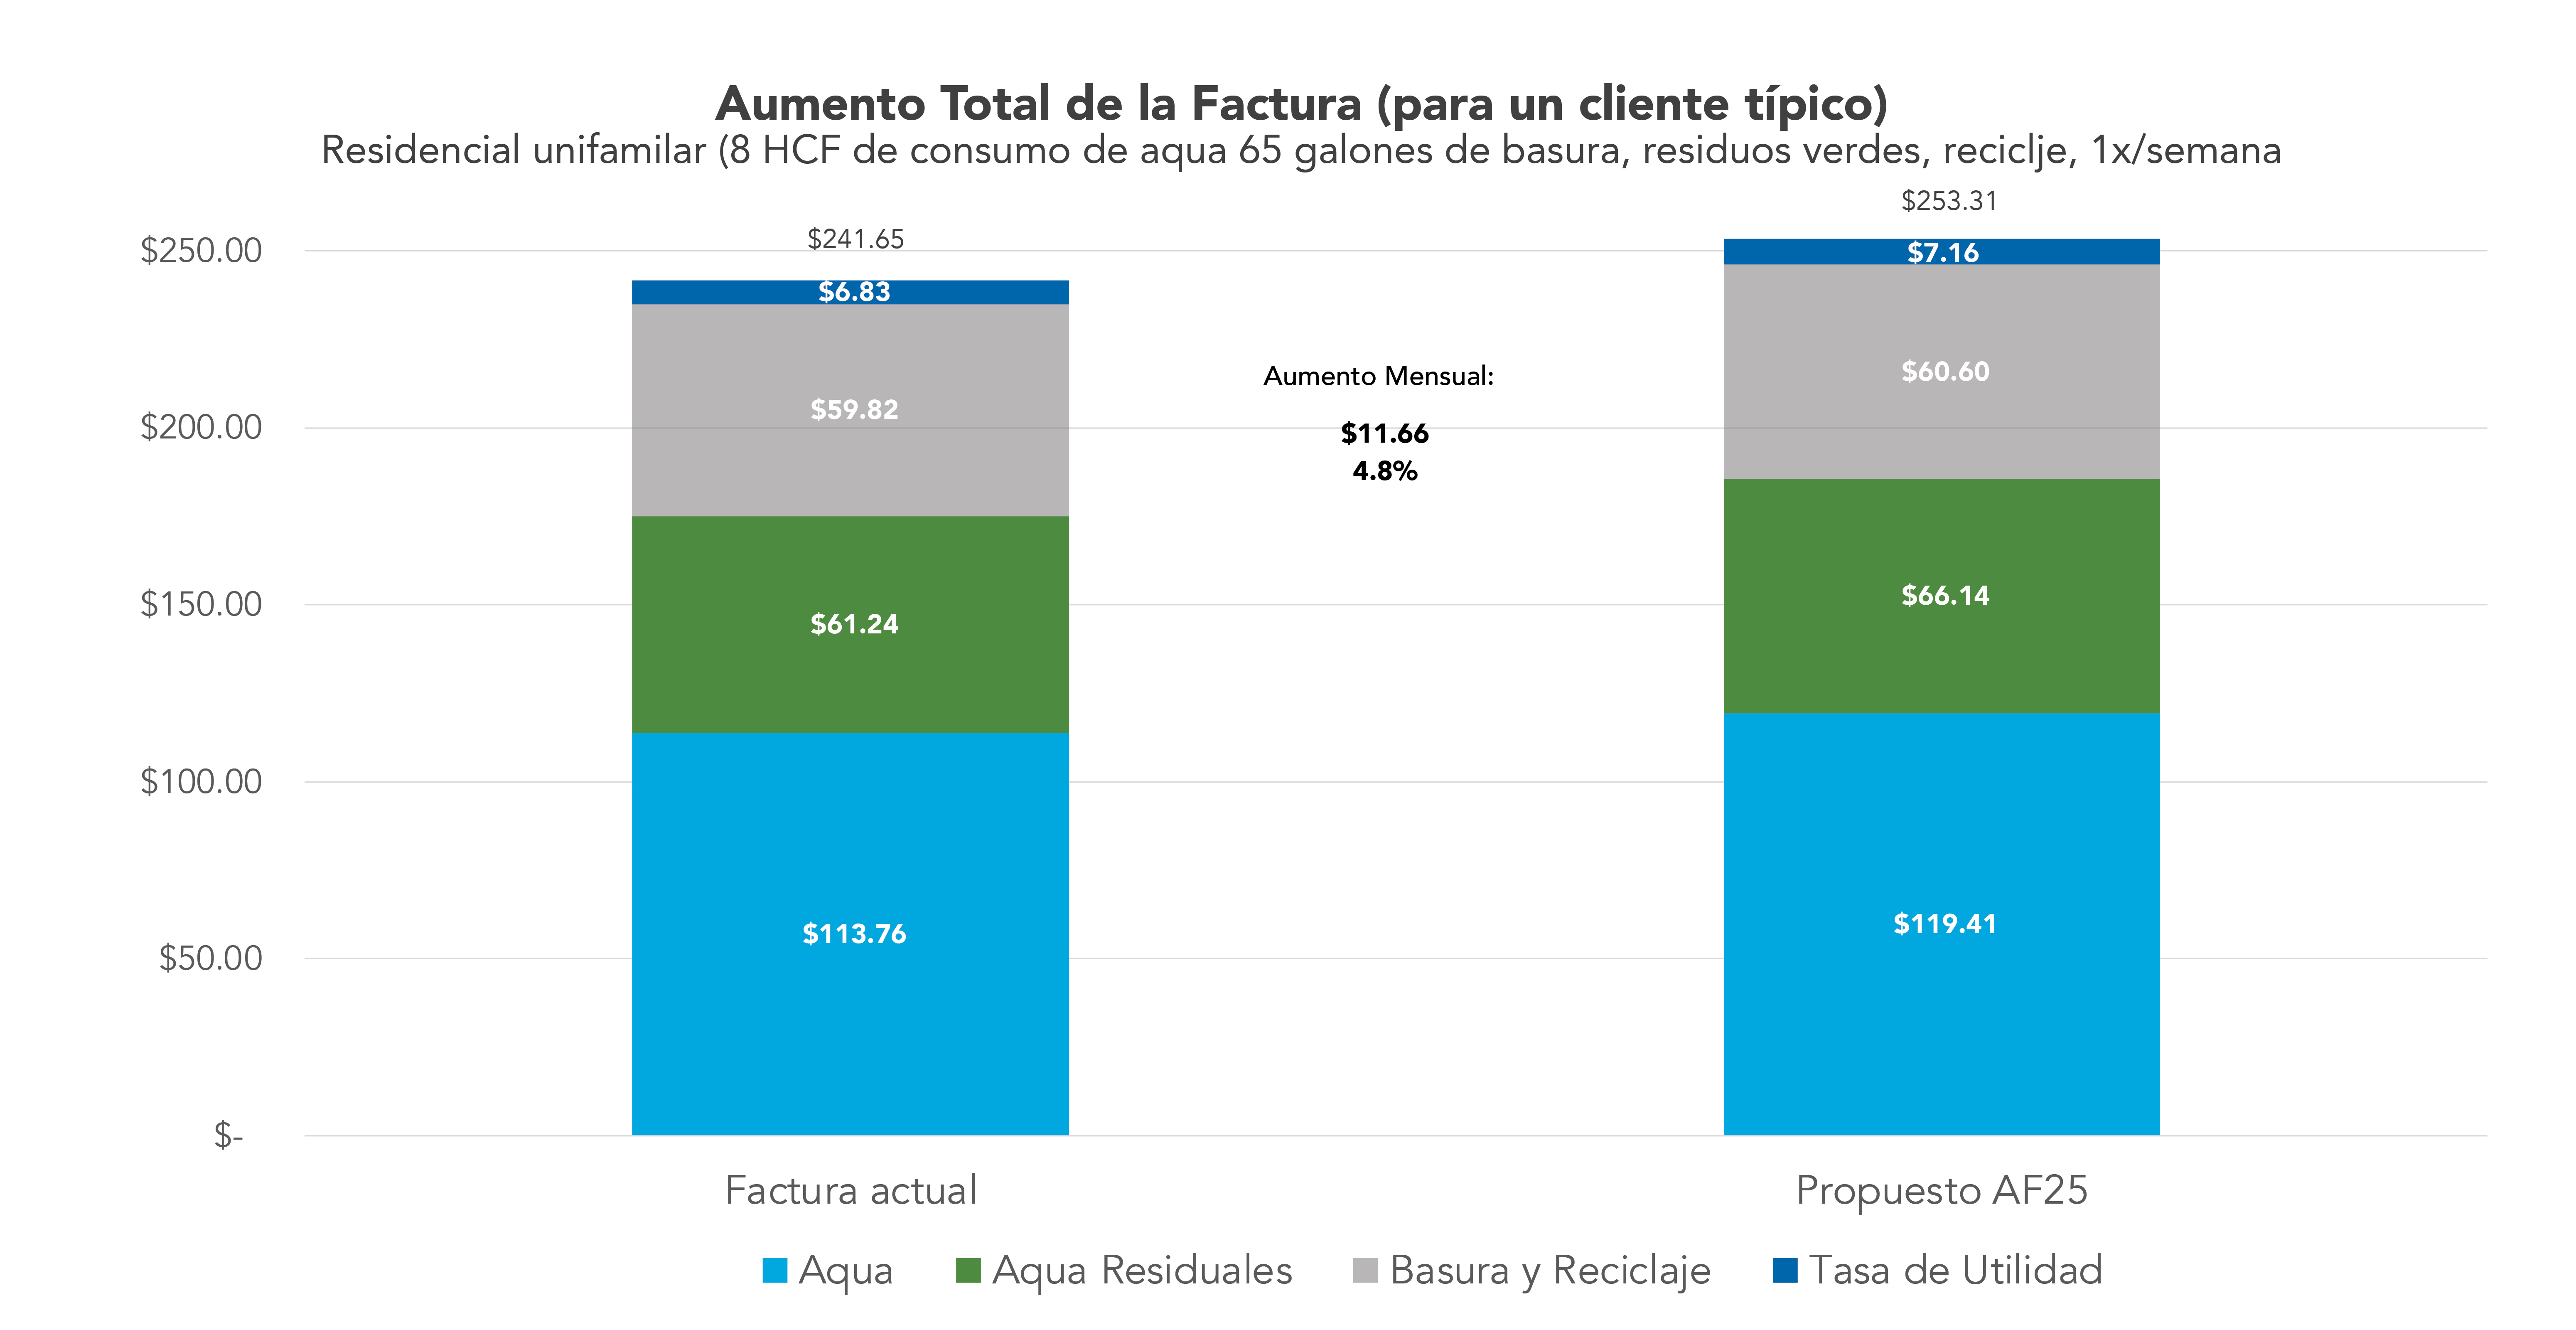
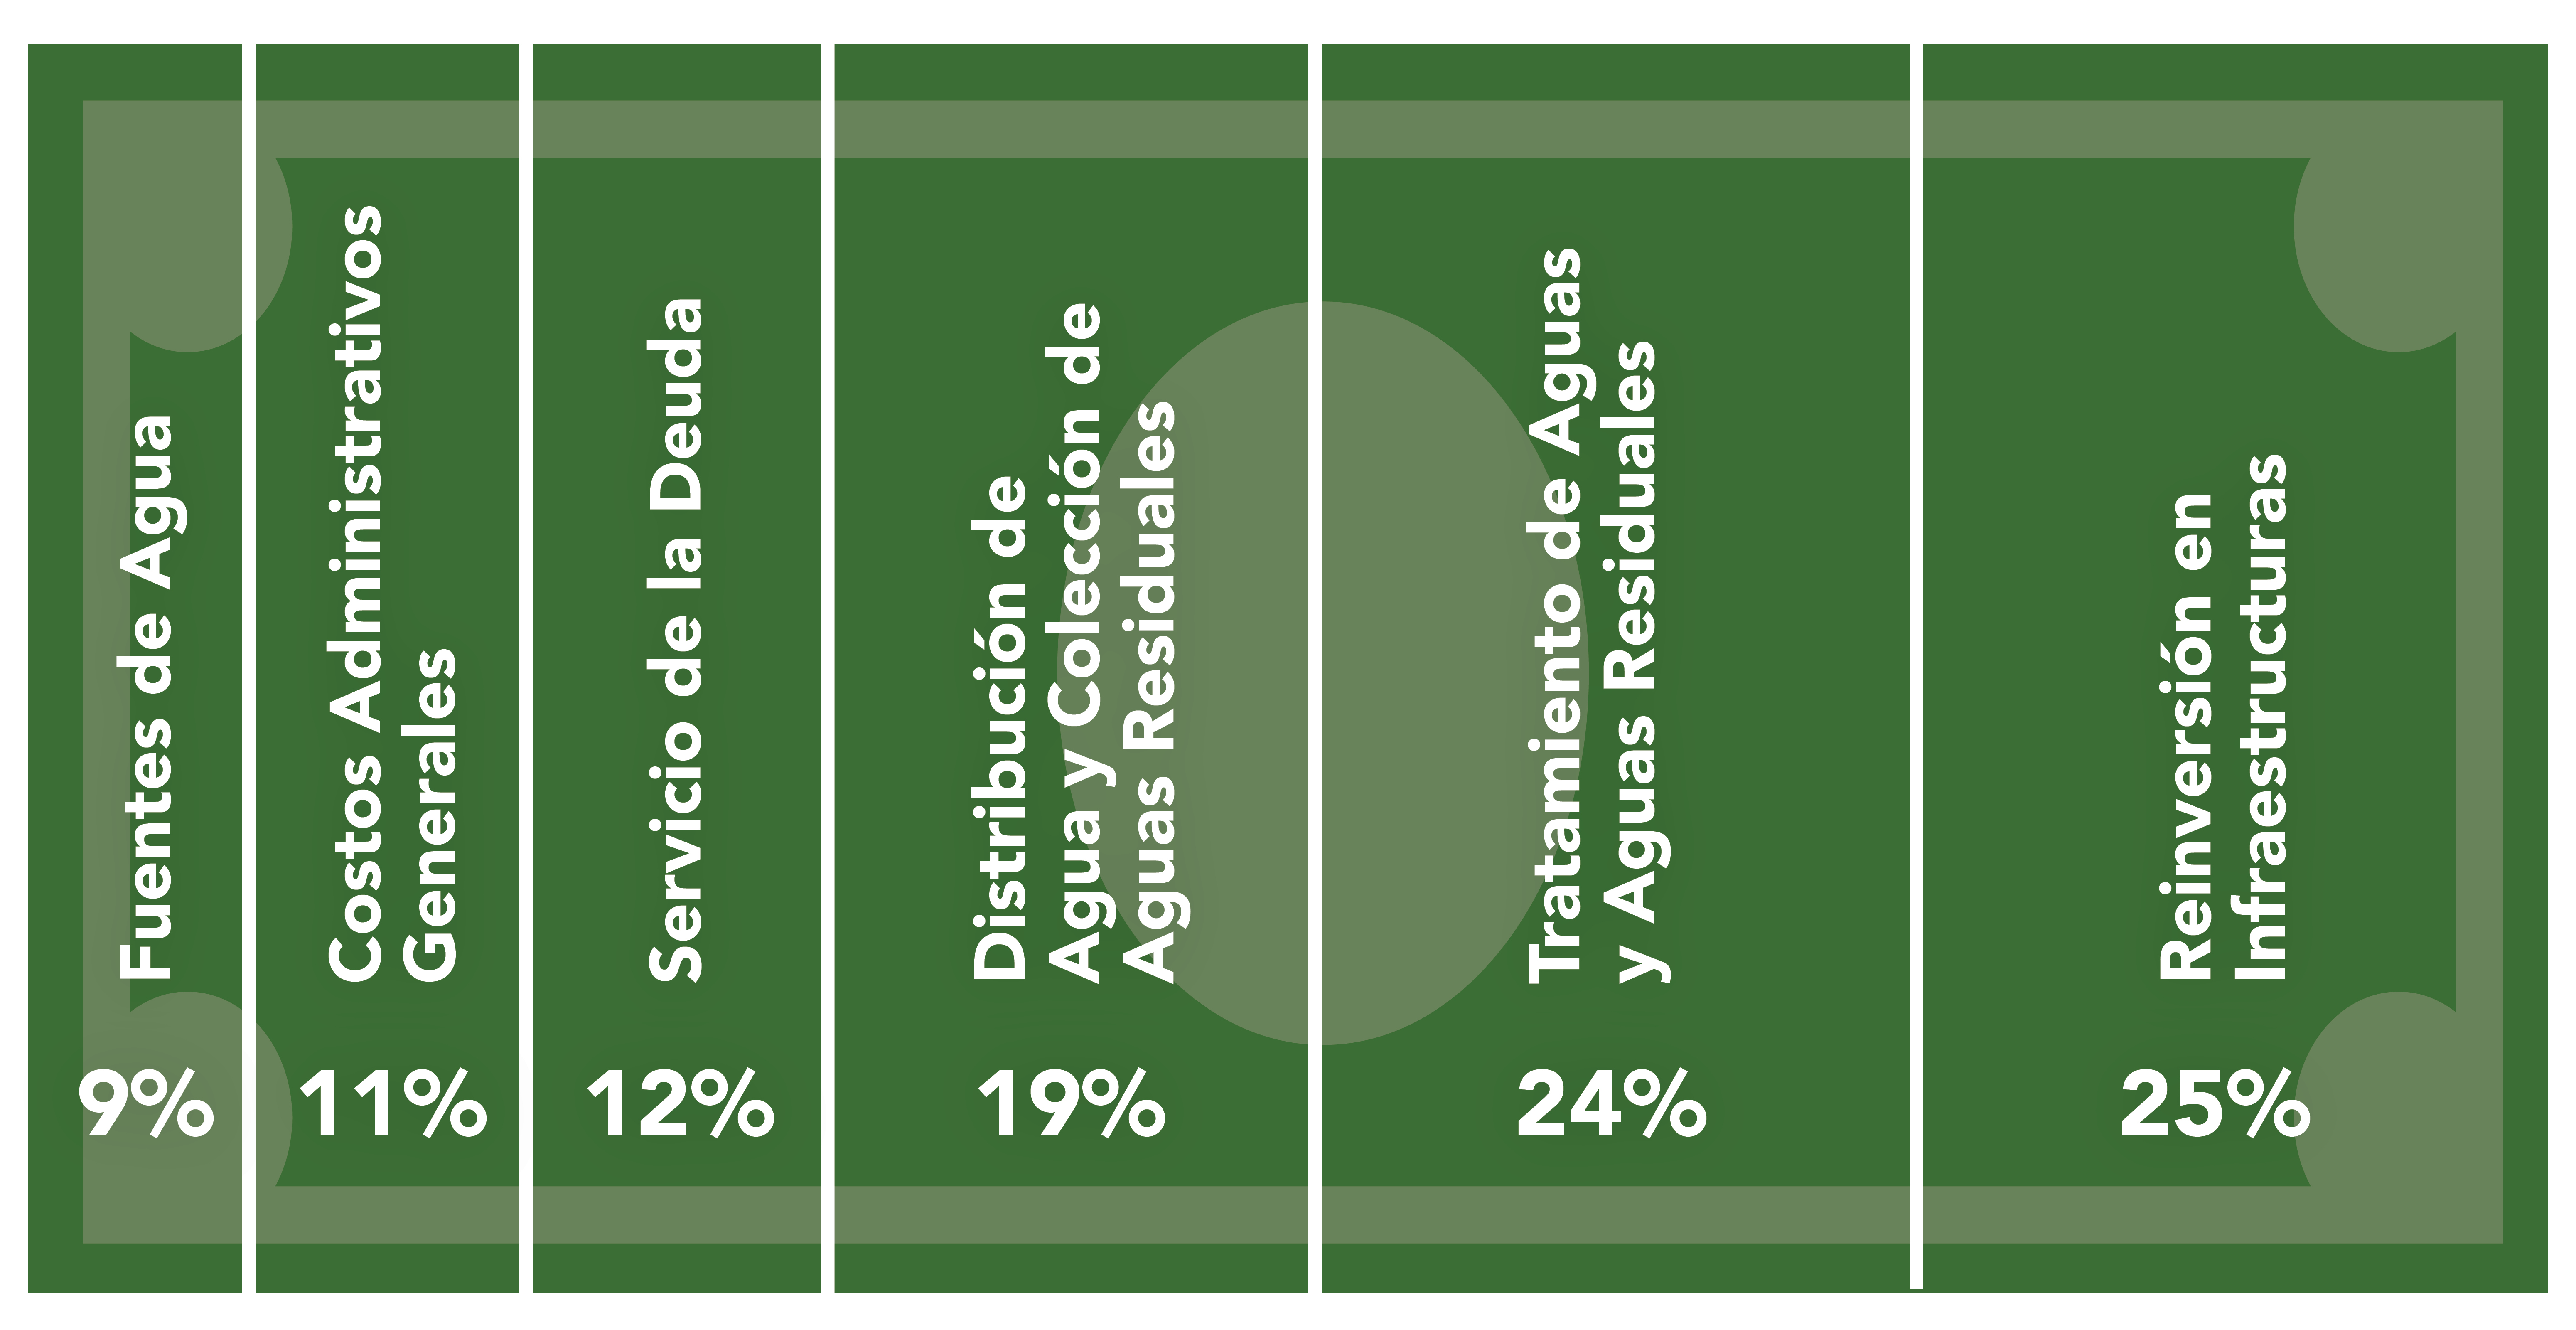
Lo que paga su factura
Su factura mensual ayuda a garantizar que nuestros sistemas de agua y aguas residuales se mantengan y funcionen las 24 horas del día, lo cual es clave para proteger la salud pública y el medio ambiente.
Aumentos de tarifas
Como empresa de servicio público, nuestras tarifas sólo pueden incluir los costos de prestación de los servicios de agua y alcantarillado. Los ingresos procedentes de las tarifas se utilizan para gestionar los servicios públicos y no generan beneficios ni se destinan a otros programas municipales.
Por desgracia, "no hacer nada" no es una opción para el mantenimiento de infraestructuras críticas. Retrasar inversiones importantes solo hará que sean más caras en el futuro y podría dar lugar a emergencias que serán exponencialmente más caras y perturbadoras que el mantenimiento planificado.
Para aplicar un plan vital a largo plazo de sustitución de tuberías e infraestructuras, la ciudad de Santa Bárbara propone ajustes anuales de tarifas durante los próximos cuatro años para los servicios de agua y aguas residuales.
Asistencia al cliente disponible
La ciudad entiende las dificultades a las que todos nos enfrentamos por el aumento de los costes y está trabajando duro para minimizar los aumentos de tarifas al tiempo que garantiza servicios seguros y fiables en los que confiamos 24/7. Para los clientes de agua, seguimos ofreciendo programas de asistencia al cliente, incluyendo planes de acuerdo de pago, una exención del Impuesto de Usuarios de Servicios Públicos para los clientes de bajos ingresos que califiquen, alivio de fugas de agua, y una mezcla de reembolsos residenciales y comerciales para fomentar el uso eficiente del agua. Recientemente hemos colaborado con la Alianza para la Eficiencia del Agua en un estudio sobre la asequibilidad de las tarifas del agua para evaluar los problemas de asequibilidad y las posibles soluciones.
Comparación de tarifas con las agencias vecinas